
 SJVAir Toolkit
Maps
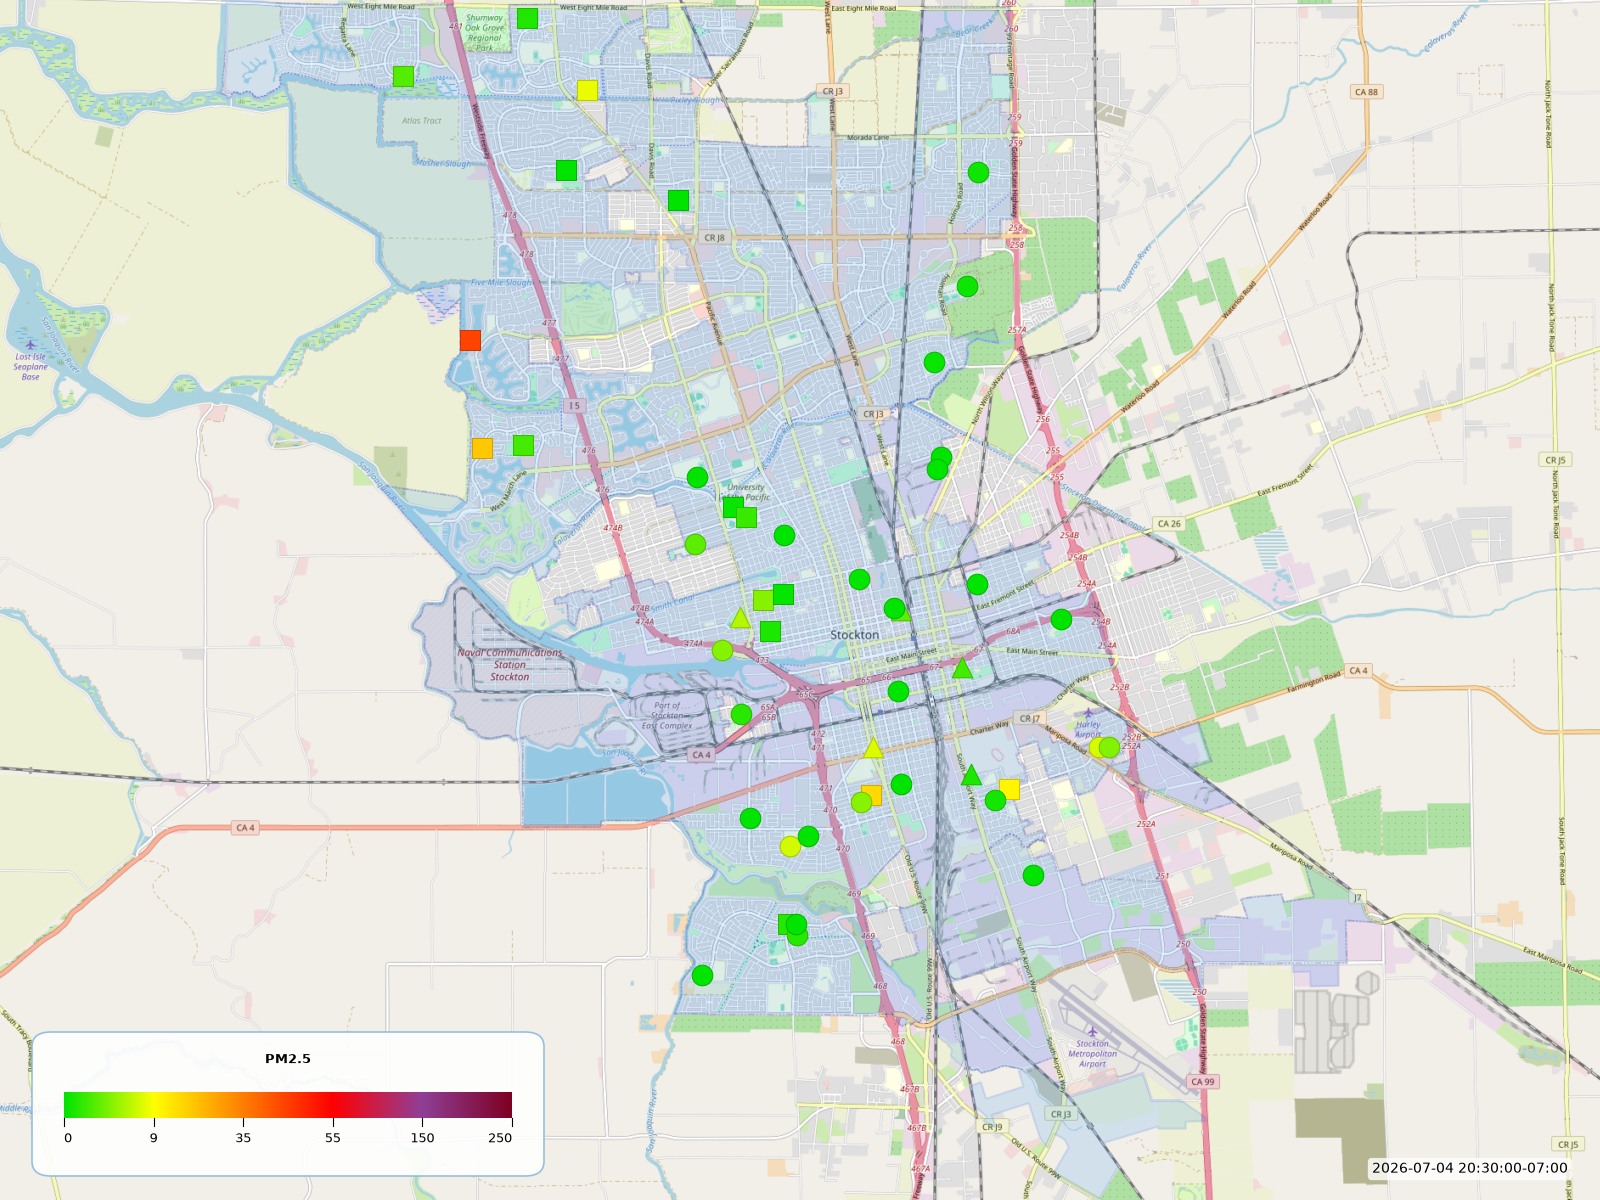
sjvair.maps.render_frame — the same rendering function behind sjvair map create/sjvair timelapse create — is importable directly for scripting. Requires pip install sjvair[maps] (matplotlib, contextily, geopandas, shapely) to actually render; importing sjvair.maps itself never requires it.
from pathlib import Path
from sjvair import SJVAirClient
from sjvair.maps import render_frame

with SJVAirClient() as client:
    region = client.regions.get(region_id)
    levels = client.monitors.meta()['entries']['pm25']['levels']
    monitors = list(client.monitors.current('pm25'))

    png_bytes = render_frame(
        monitors=monitors,
        levels=levels,
        outlines=[region['boundary']['geometry']],
        viewport=(-120.5, 36.0, -119.5, 37.0),  # west, south, east, north
        timestamp_label='2026-07-04 20:30 PDT',
    )
    Path('map.png').write_bytes(png_bytes)
This produces the same kind of image as sjvair map create:
For historical snapshots and timelapses, sjvair map create/sjvair timelapse create already handle region resolution, viewport/bbox computation, and video assembly — see the CLI guide.